Results
 The response rate to the 2013 Employee Engagement Survey is 72%, a significant increase of 22% from the 2011 survey, and the highest response rate to date.
| Response |
49% |
54% |
51% |
50% |
72% |
The links below provide:
When considering the overall University results the chart below highlights positive gains across all of the themes when compared to the 2011 data, and also shows the highest scores across all themes since 2009.
| Atmosphere of cooperation |
58 |
61 |
57 |
53 |
59 |
+6 |
Moderate strength |
| Equity |
52 |
55 |
50 |
48 |
59 |
+11 |
Moderate strength |
| Leadership |
49 |
54 |
39 |
40 |
49 |
+9 |
Opportunity for improvement |
| Personal development |
55 |
56 |
52 |
50 |
55 |
+5 |
Moderate strength |
| Overall satisfaction |
69 |
71 |
60 |
59 |
66 |
+7 |
Clear strength |
| Overall employee engagement |
- |
- |
- |
- |
73 |
- |
Clear strength |
Overall employee engagement is high at 73% and this new theme is based on 15 questions introduced into the 2013 survey. This is followed by overall satisfaction at 66% which has increased by 7% since 2011. Both are deemed to be ‘clear strengths’ when considering the general benchmarks.
Atmosphere of cooperation, equity and personal development are deemed to be ‘moderate strengths’, and each of these show an increase when compared to the 2011 data, ranging from 5 to 11% with equity showing the highest increase of 11% its highest score across all five sets of data.
Leadership also shows an increase of 9% when compared to the 2011 data. However, this sits within the ‘opportunity for improvement’ band when comparing it to the general guideline data that the Tracom Group provided. The only year it has not fallen within this band was in 2009 when it was considered a ‘moderate strength’. These results would indicate that this is the area that requires the most consideration with a view to implementing positive actions that all senior management are committed to carrying out. The increase in 2013 indicates that the trend is moving in the right direction and positive activity needs to continue to ensure that it continues to do so.
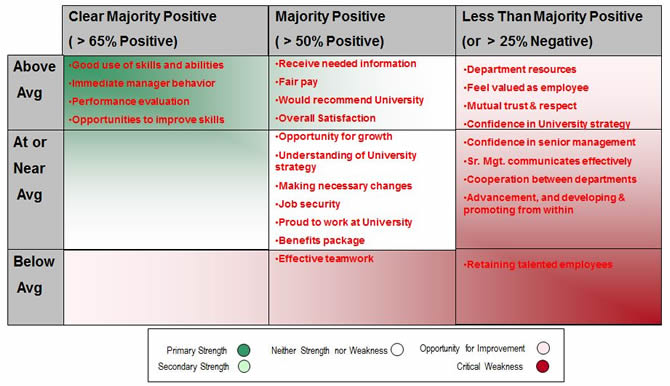
The key results matrix below highlights our primary strengths and our areas for improvement.